4.4.2 Example: South African Heart Disease

%matplotlib inline
import numpy as np
import pandas as pd
import matplotlib.pyplot as plt

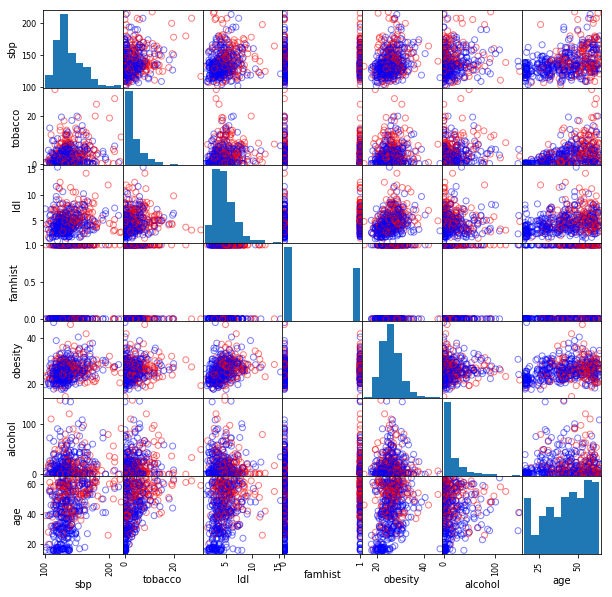
df = pd.read_csv('../data/SAheart/SAheart.data', index_col = 0)
df['famhist'] = df['famhist'].map({'Present': 1, 'Absent': 0})

# These columns are not used in the book.
df.pop('adiposity')
df.pop('typea')

df_y = df.pop('chd')
df.head()
sbp tobacco ldl famhist obesity alcohol age
row.names
1 160 12.00 5.73 1 25.30 97.20 52
2 144 0.01 4.41 0 28.87 2.06 63
3 118 0.08 3.48 1 29.14 3.81 46
4 170 7.50 6.41 1 31.99 24.26 58
5 134 13.60 3.50 1 25.99 57.34 49
pd.plotting.scatter_matrix(df, marker='O',
                           facecolors = 'none', 
                           edgecolors = df_y.map({0: 'blue', 1: 'red'}),
                           figsize = (10, 10))
plt.show()

class LogisticRegression:
    def predict(X):
        X = np.c_[np.ones((X.shape[0], 1)), X]
        return self._sigmoid(X @ self.beta)
    
    def fit(self, X, y):
        X = np.c_[np.ones((X.shape[0], 1)), X]
        self.beta = np.zeros(X.shape[1])
        
        while True:
            p = self._sigmoid(X @ self.beta)
            W = np.diag(p * (1 - p)) 
            derivative = X.T @ (y - p)
            hessian = -X.T @ W @ X

            if np.allclose(derivative, 0):
                break    
            self.beta -= np.linalg.inv(hessian) @ derivative
        
        self.stderr = np.sqrt(np.diag(np.linalg.inv(-hessian)))
        self.z_score = self.beta / self.stderr
        return self
    
    def _sigmoid(self, x):
        return 1 / (1 + np.exp(-x))

model = LogisticRegression().fit(df.values, df_y.values)

pd.options.display.float_format = '{0:.3f}'.format

pd.DataFrame(data = {'Coefficient': model.beta, 
                     'Std. Error': model.stderr,
                     'Z Score' : model.z_score}, 
             index = ["Intercept", *df.columns.tolist()])
Coefficient Std. Error Z Score
Intercept -4.130 0.964 -4.283
sbp 0.006 0.006 1.023
tobacco 0.080 0.026 3.034
ldl 0.185 0.057 3.218
famhist 0.939 0.225 4.177
obesity -0.035 0.029 -1.187
alcohol 0.001 0.004 0.136
age 0.043 0.010 4.181