%matplotlib inline
import numpy as np
import matplotlib.pyplot as plt
def filtered_data(path):
data_all = np.loadtxt(path)
mask = np.in1d(data_all[:, 0], (2, 3))
data_x = data_all[mask, 1: ]
data_y = data_all[mask, 0]
return data_x, data_y
train_x, train_y = filtered_data('../data/zipcode/zip.train')
test_x, test_y = filtered_data('../data/zipcode/zip.test')
k_list = [1, 3, 5, 7, 15]
def knn_error(k, x, y, data_x, data_y):
distances = ((data_x - x)**2).sum(axis=1)
return (np.mean(data_y[distances.argpartition(k)[:k]]) - y) ** 2
def std(squared_errors):
"""standard deviation of the given squared errors."""
return np.sqrt(np.mean(squared_errors))
def knn_stds():
train_stds = []
test_stds = []
for k in k_list:
train_errors = [knn_error(k, x, y, train_x, train_y)
for (x, y) in zip(train_x, train_y)]
train_stds.append(std(train_errors))
test_errors = [knn_error(k, x, y, train_x, train_y)
for (x, y) in zip(test_x, test_y)]
test_stds.append(std(test_errors))
return train_stds, test_stds
def least_square_stds():
X = np.c_[np.ones((len(train_x), 1)), train_x]
beta = np.linalg.lstsq(X, train_y, rcond = None)[0]
error = lambda x, y: (np.dot(np.array([1, *x]), beta) - y) ** 2
train_stds = []
test_stds = []
for k in k_list:
train_errors = [error(x, y) for (x, y) in zip(train_x, train_y)]
train_stds.append(std(train_errors))
test_errors = [error(x, y) for (x, y) in zip(test_x, test_y)]
test_stds.append(std(test_errors))
return train_stds, test_stds
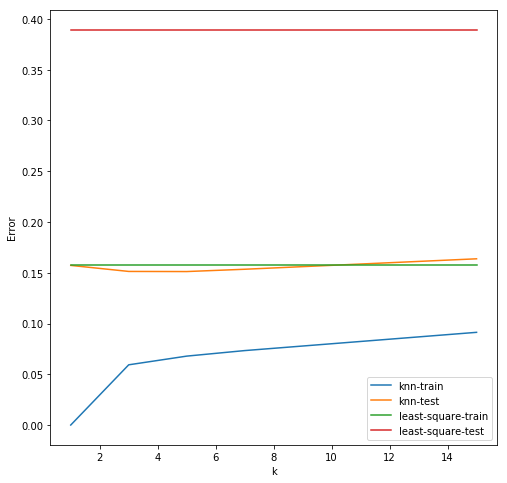
fig = plt.figure(figsize = (8, 8))
axes = fig.add_subplot(1, 1, 1)
# kNN plotting
train_stds, test_stds = knn_stds()
axes.plot(k_list, train_stds, '-',
color = 'C0', label = 'knn-train')
axes.plot(k_list, test_stds, '-',
color = 'C1', label = 'knn-test')
# least square plotting
train_stds, test_stds = least_square_stds()
axes.plot(k_list, train_stds, '-',
color = 'C2', label = 'least-square-train')
axes.plot(k_list, test_stds, '-',
color = 'C3', label = 'least-square-test')
axes.legend()
axes.set_xlabel("k")
axes.set_ylabel("Error")
plt.show()